YOUR REPORT
Powered by

At Noble Scouting, we go way beyond the surface. Our reports are designed to provide young footballers and their families with a comprehensive, pro-level evaluation, combining Elite Scout expertise with cutting-edge performance data.
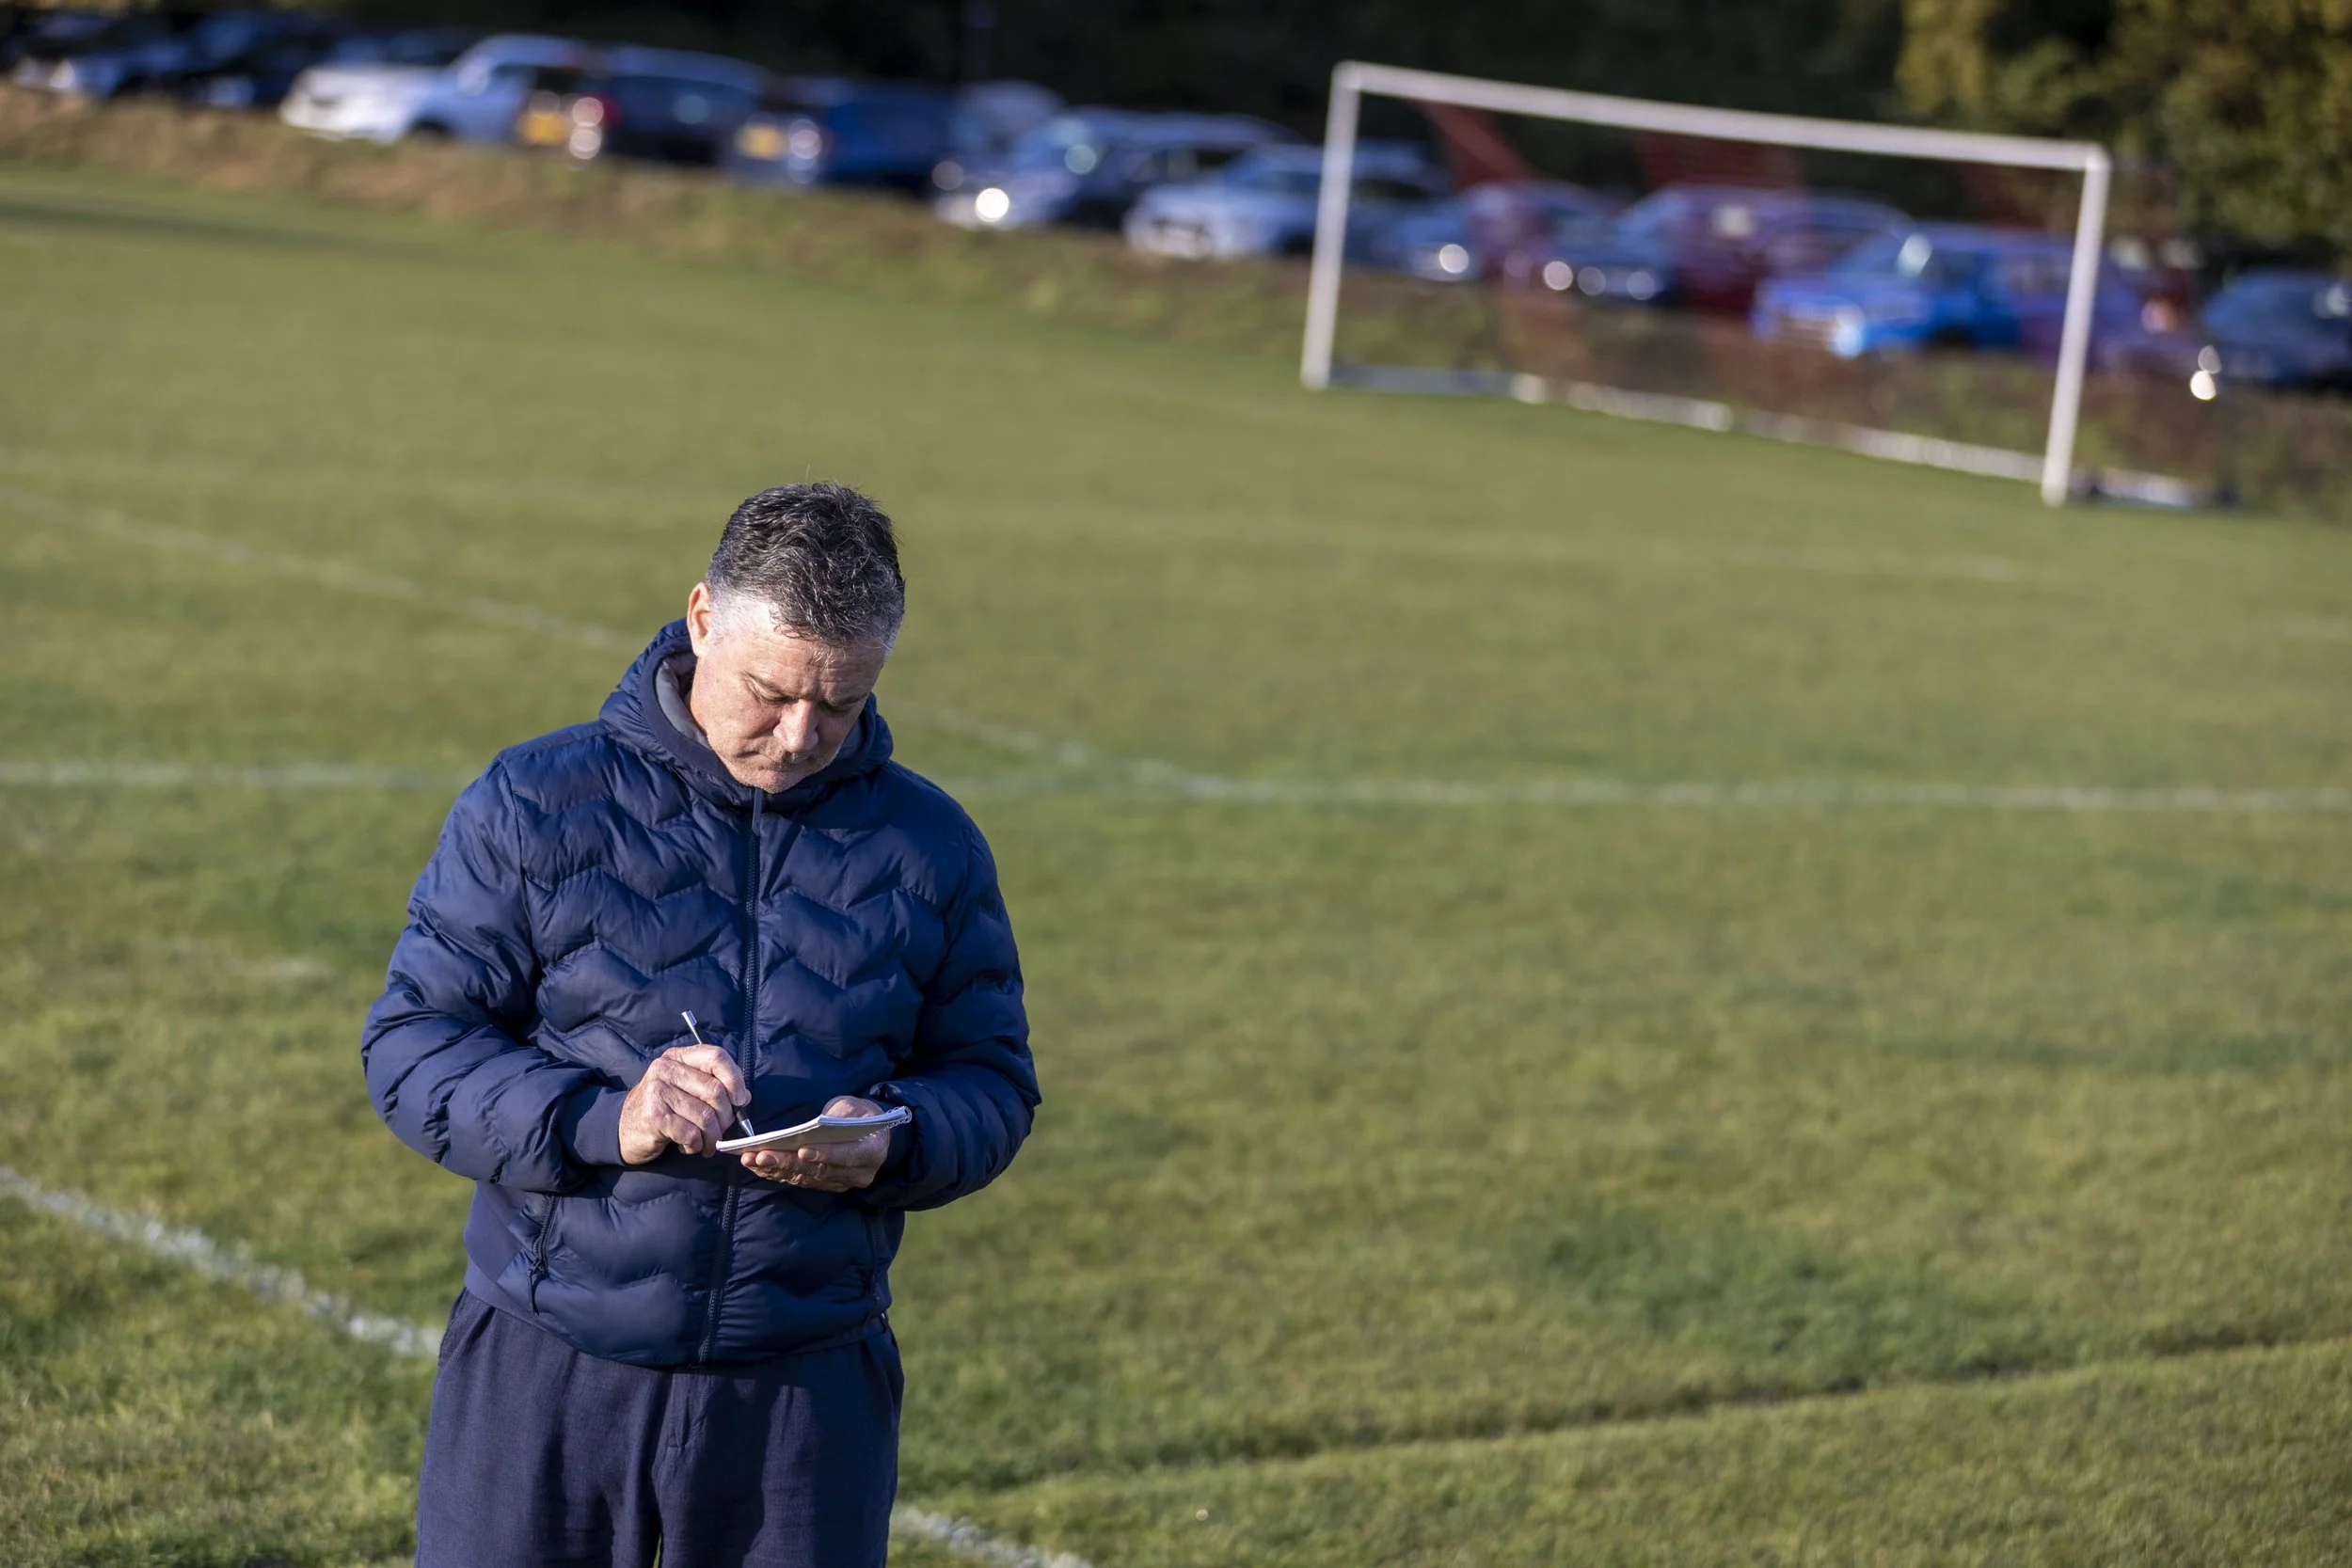
SCOUT EVALUATION
A qualified scout will attend your match in person, observing every moment through the lens of the FA’s Official Four Corner Model. This covers technical, physical, psychological, and social aspects.

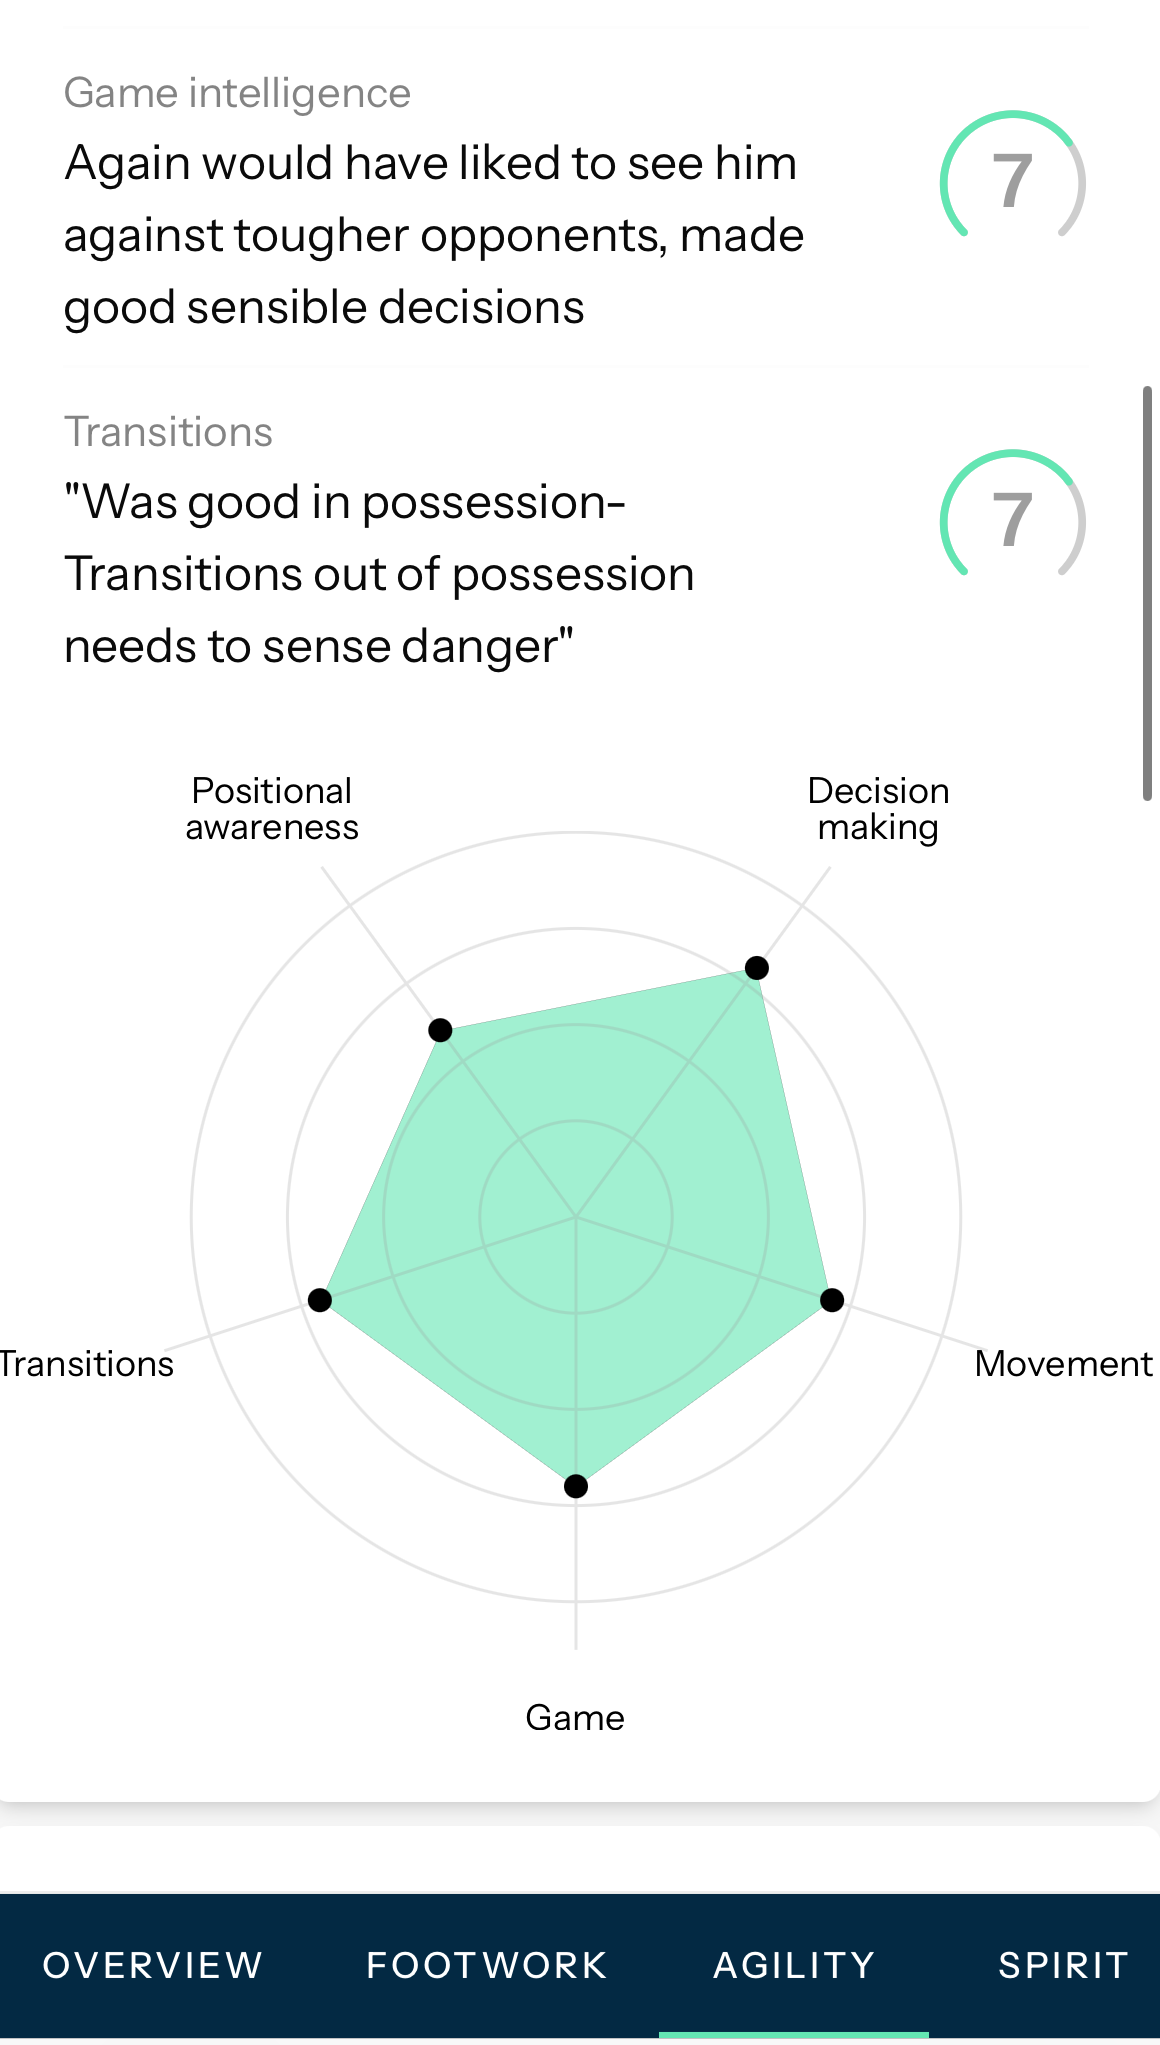
TECHNICAL / TACTICAL
From first touch to decision making, we analyse how you play the game.
PSYCHOLOGICAL
Confidence, resilience and focus, your mindset matters.
SOCIAL
Communication, teamwork and leadership. We see how you connect on and off the pitch.
PHYSICAL
Speed, strength and stamina. We measure what drives your performance.

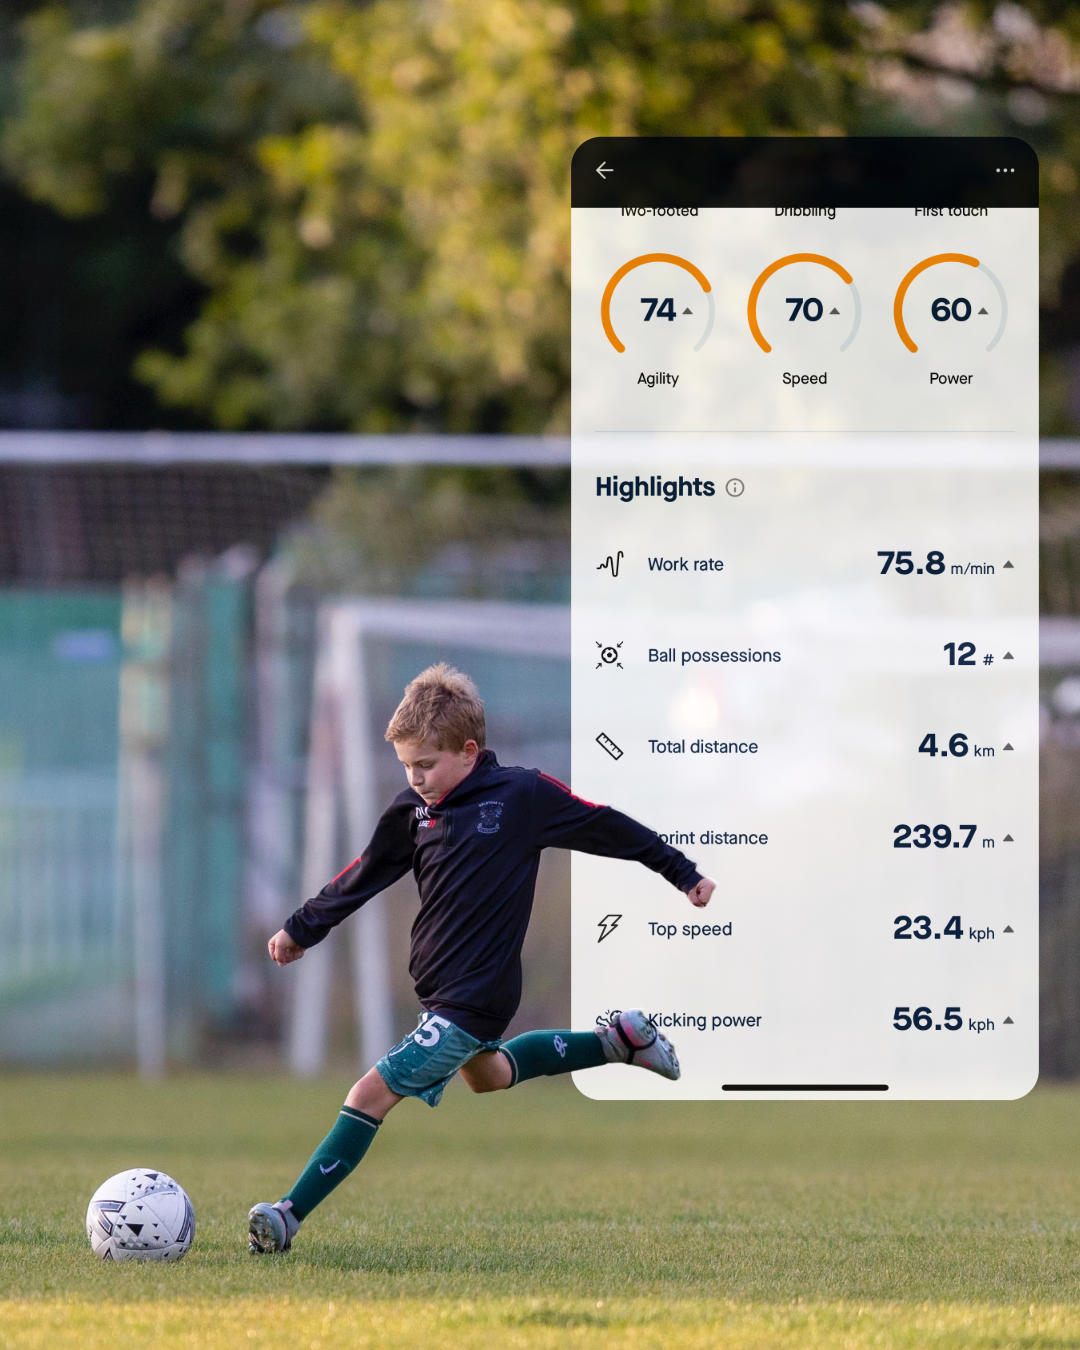
2. Playermaker Data
Thanks to our partnership with Playermaker, we offer cutting-edge performance tracking used by top academies and professional clubs worldwide. Their FIFA-approved wearable technology captures every movement, touch, and decision a player makes in training or in matches.
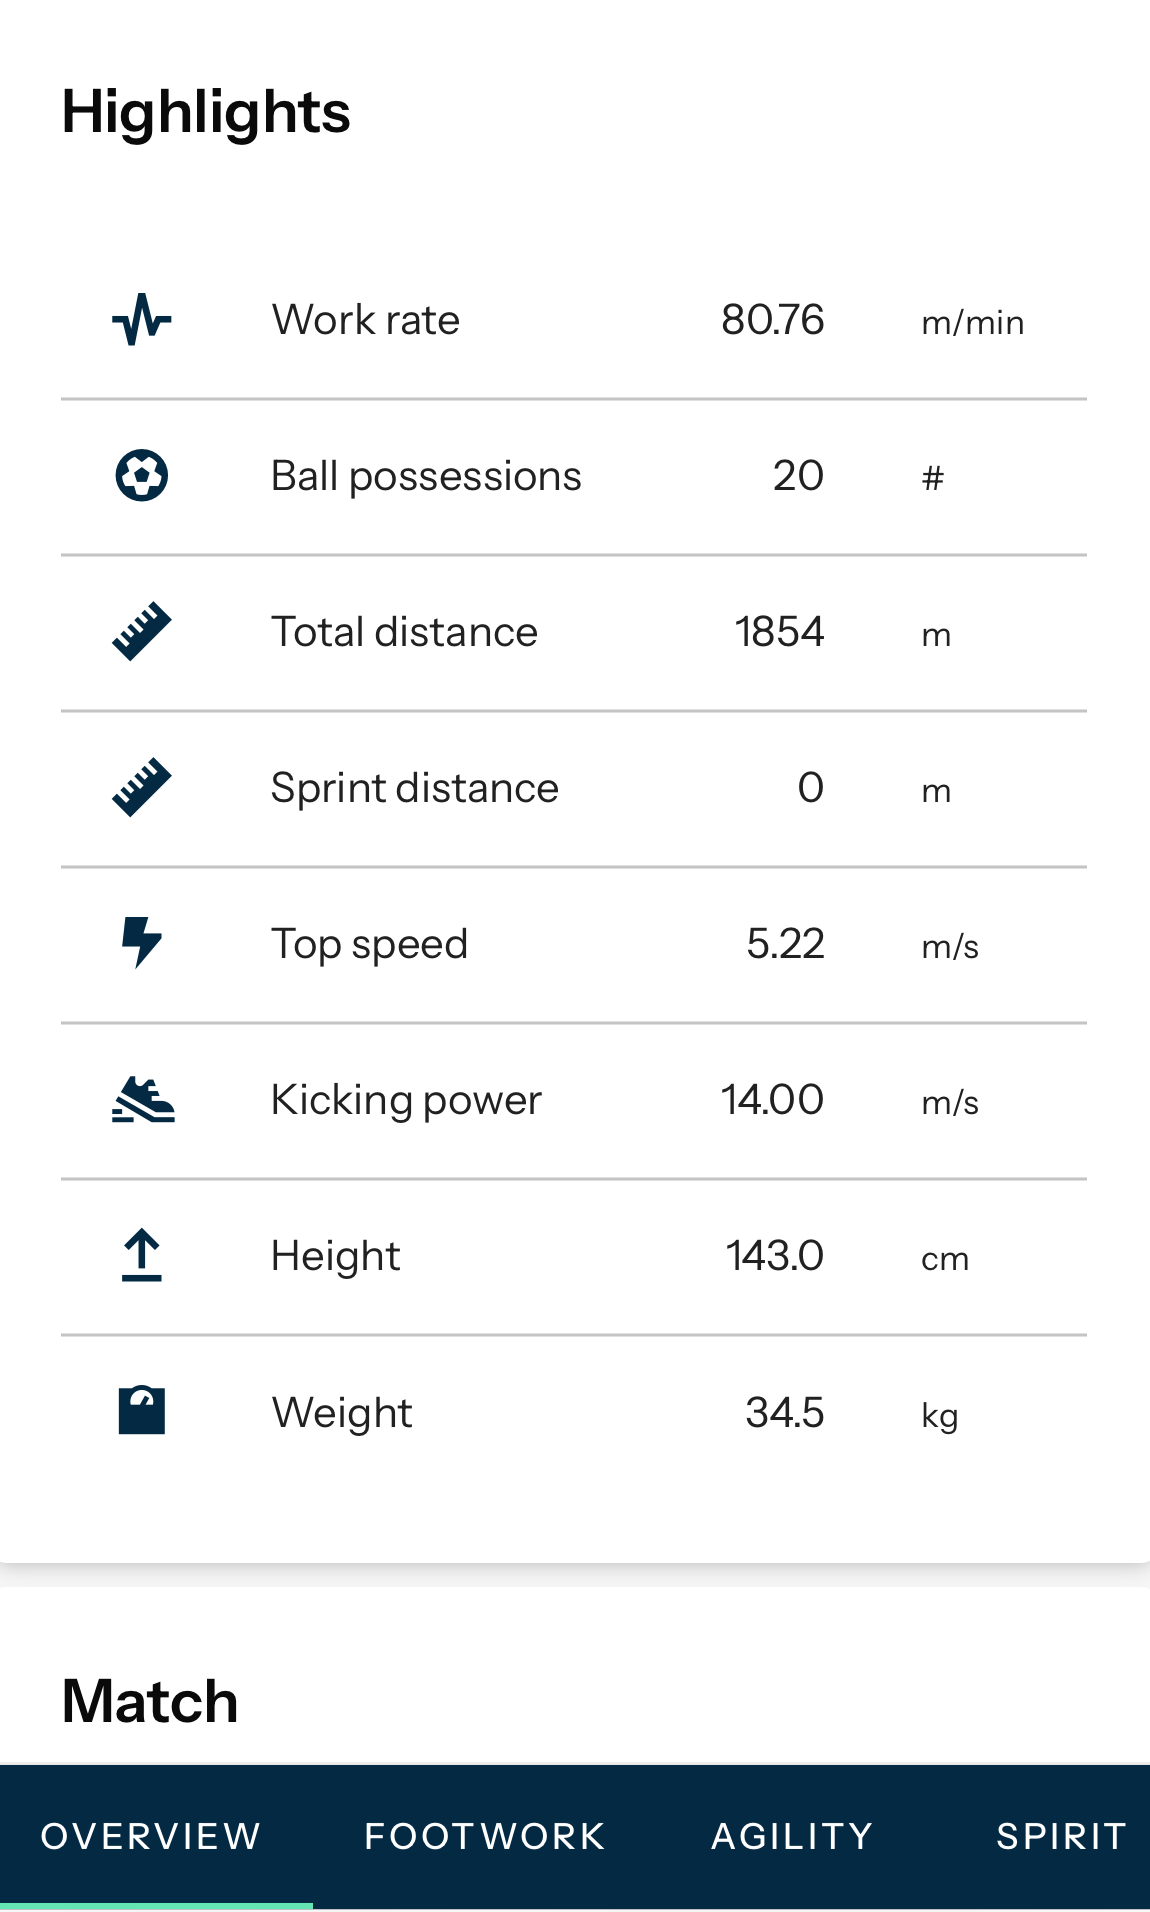
We collect elite-level technical and physical performance data using wearable boot-mounted sensors. This includes:
Ball touches and leg usage
Time on the ball and release speed
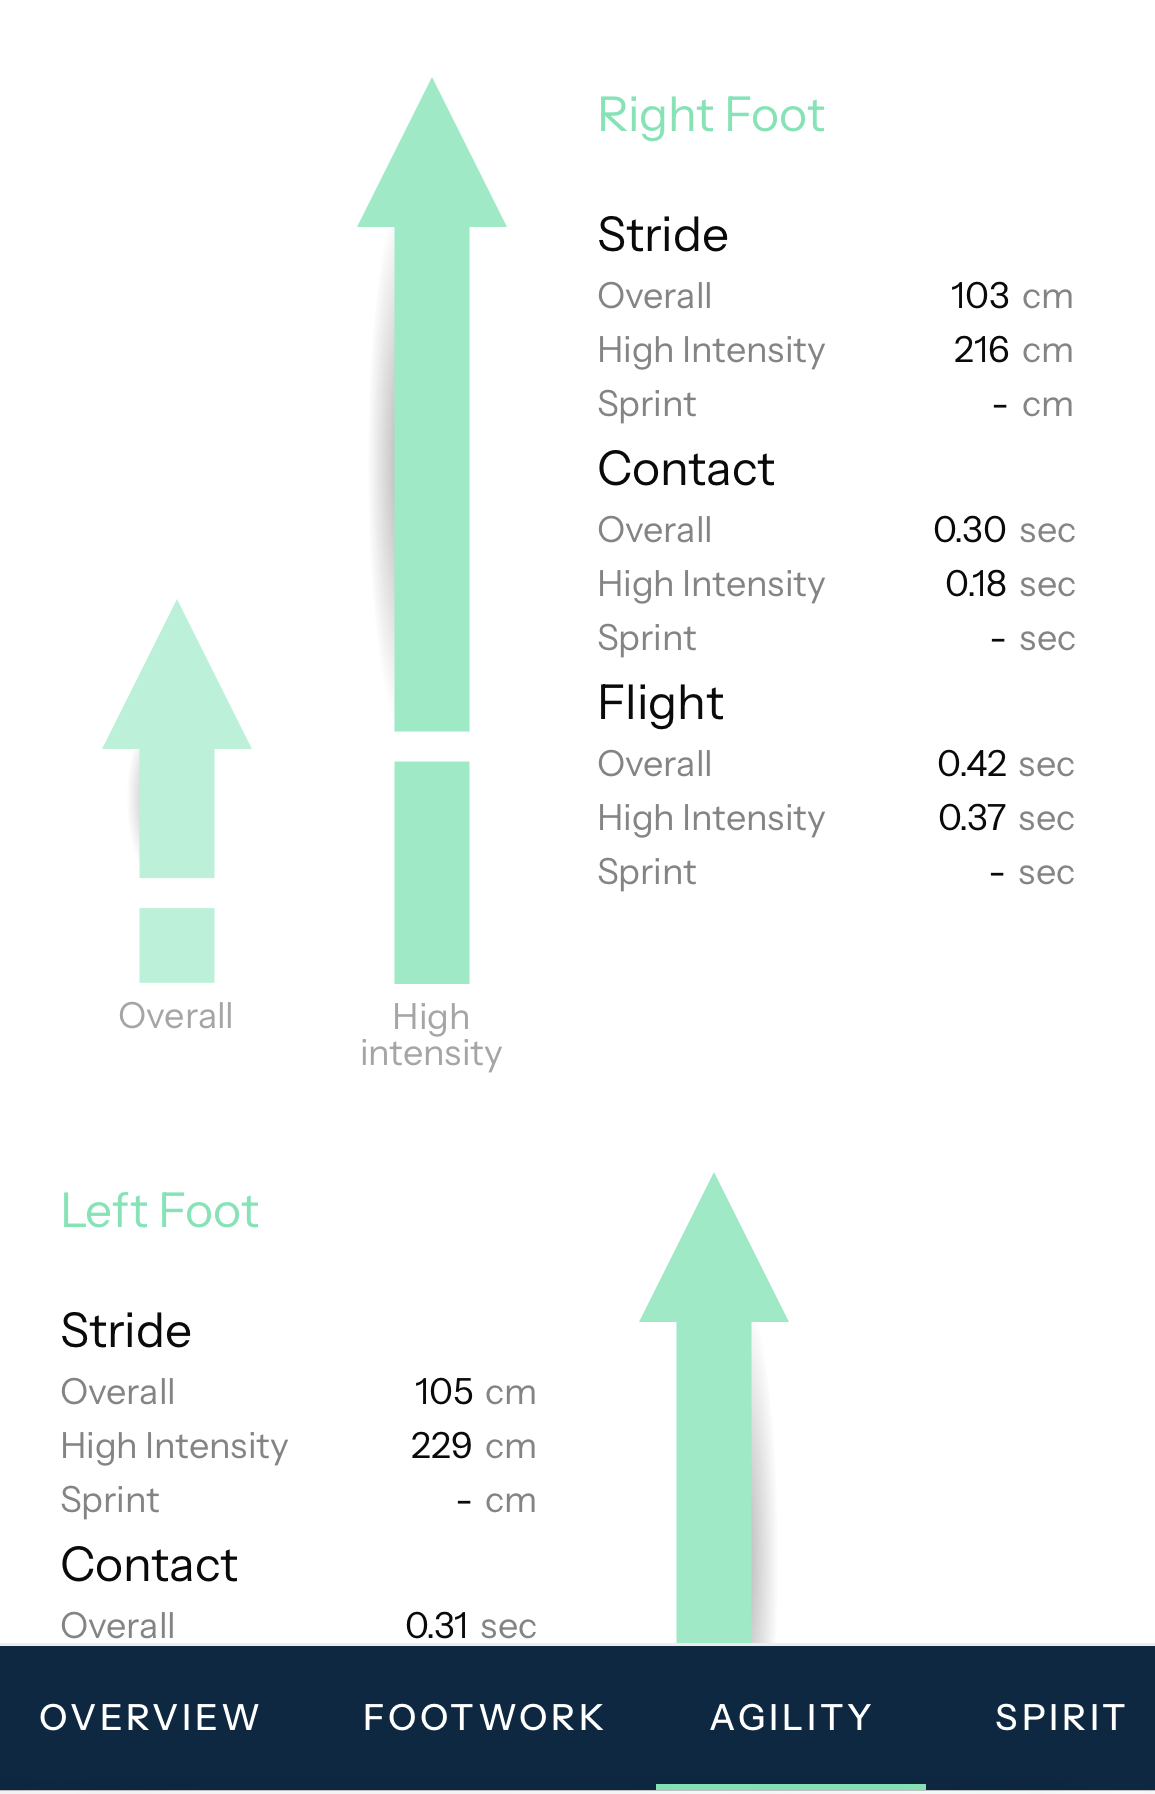
Kicking velocity, stride length, and gait analysis
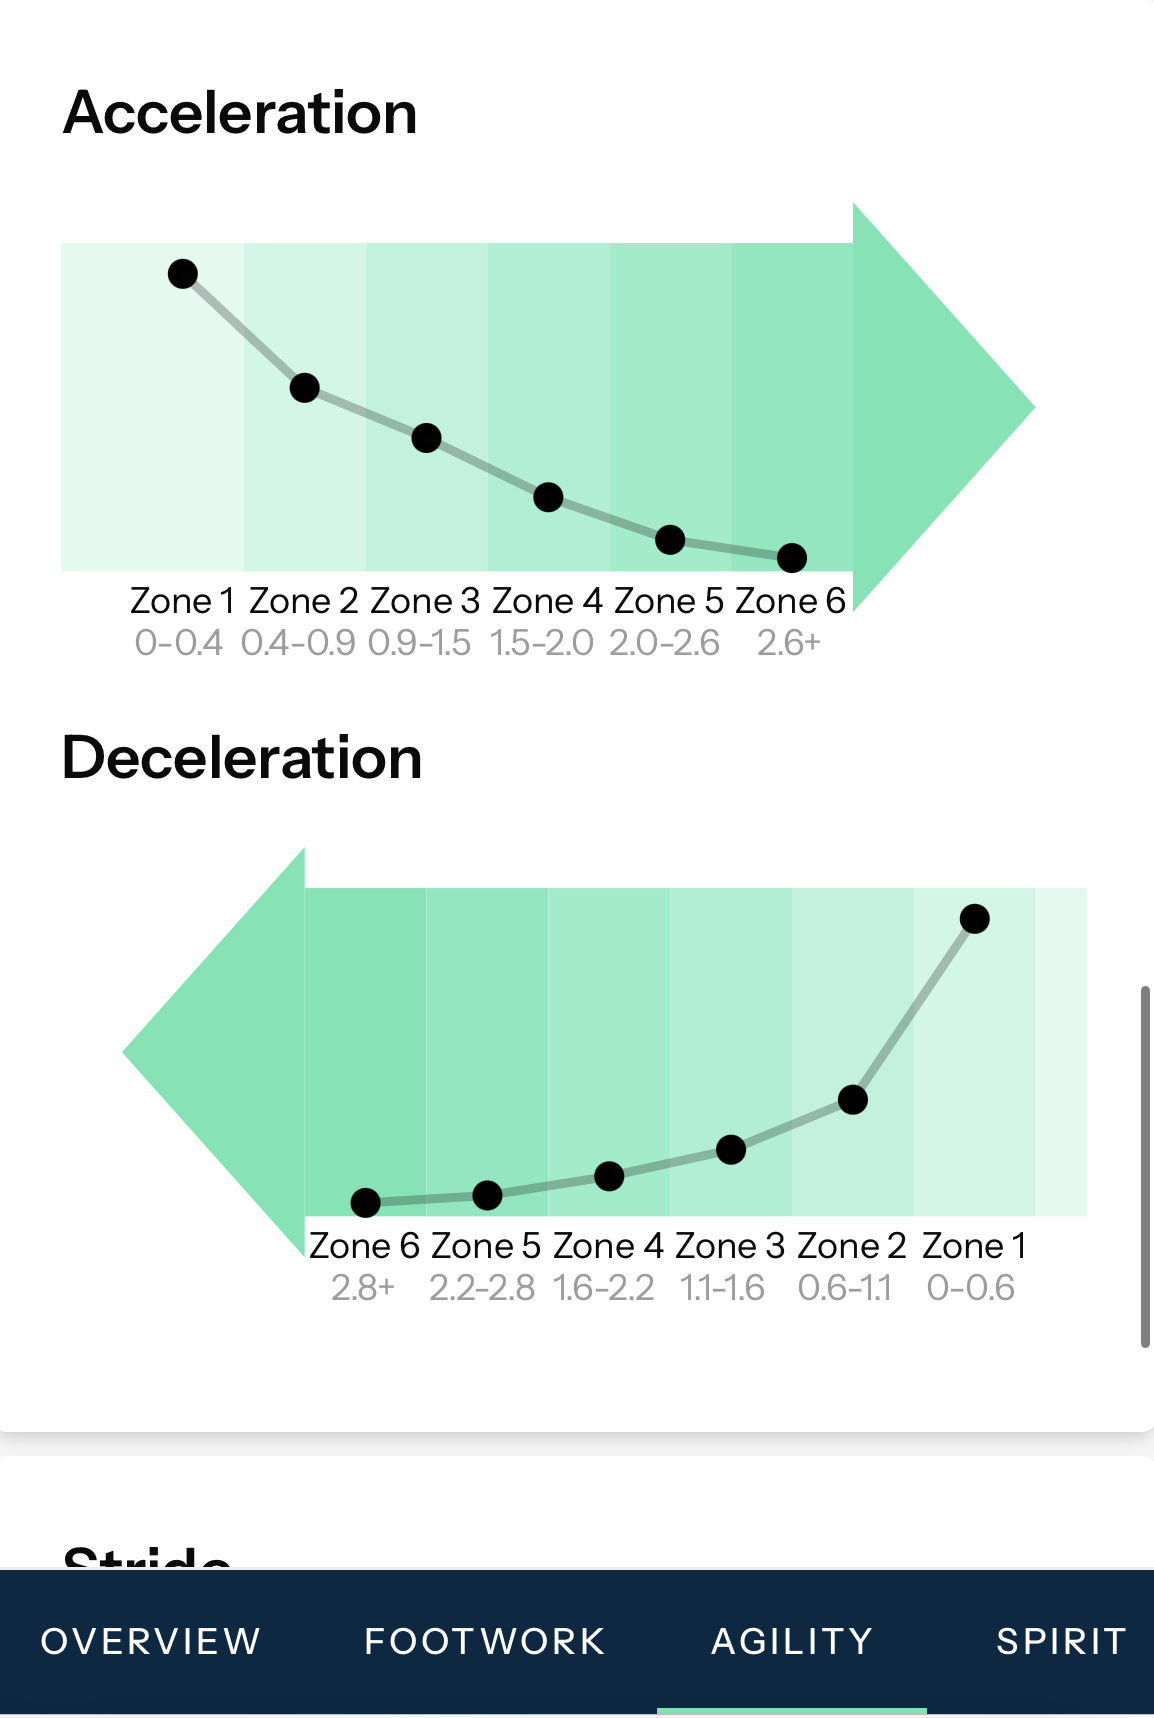
Distance covered, sprint speed, and acceleration/deceleration
Tactical insights like passing networks and possession stats
This data gives us a 360° view of a player’s technical and physical profile, benchmarked against professional standards. It helps us identify strengths, track progress, and tailor development plans with precision.
3. Your NOBLE SCORE
We’re the only scouting service that combines an Elite Scout match analysis with performance data.
It’s not one or the other. It’s both.
After the match, the scout will combine their observations with the data to produce a detailed, personalised report. Each report includes three key scores:
Footwork, Agility, and Spirit. This forms your unique Noble Score which helps determine the next steps in your footballing journey, whether it's further development or an intro to a pro club.

80+
Strong Candidate: Already showing high potential; a player clubs may consider signing.
71–79
Trial Ready: Ready for a trial environment; shows promise to step up.
61–70
Development required: Real potential, worth monitoring and supporting; scouts & coaches can provide guidance to help growth.
Below 61
Indicates further development is required before considering professional steps.
4. Your FINAL REPORT AND NEXT STEPS
Your personalised Noble Scouting report delivers both Elite Scout insight and real performance data, giving you the full picture, not just one side of the story.